Changelog
Follow up on the latest improvements and updates.
RSS
Improved some logic around televising Laterals on our Desktop app:
when starting a "Lateral Launch:"
- default Direction is set to Upstream
- PACP counter distance at the time of launch becomes "Tap Location"
- Pipe Use is carried through fro the PACP inspection
whereas if you start a Lateral from scratch
- don't guess at the Direction
- don't assume the starting code is an AML
Sometimes you need to make bulk edits to data in PIONEER.
Maybe you need to correct a customer name, or update pipe material, or fill in missing manhole Cover Siazes.
We have long had a CSV bulk editing tool. Now, we are introducing
SewerSheets
- a handy way to edit your data online in PIONEER.*Note: this tool is limited to Admin and Editor/Inspector roles.
Where to find it:
On PIONEER web, between the "AutoCode" and "Export" buttons you will now see "SewerSheet"

How to use it:
- Select a single Project or some other filtered set of data you want to edit
- Click the SewerSheet button
- You will see a table view of the data
- Click into any cell to edit
- Red cells are Required Fields

- Use Ctrl+C and Ctrl+V to Copy and Paste
- Use "drag handles" to copy data, just like Excel

- Hit the "Undo" button if you make a mistake (or Ctrl+Z)

- Use the column picker "Gear" to select column visibility

- Send the URL to someone else for them to edit in the same view

- The Link icon takes you to the inspection page

PIONEER's QAI (Quality Assurance for Inspections) provides an additional toolset for customers to review the integrity of their inspection data.
PIONEER ships with an array of "out of the box" QAI checks that can be run - like confirming key header data is present, the speed of travel of the crawler is within acceptable range, or the distance counter is present on-screen. Learn more about QAI here.
Previously, QAI checks had standardized titles.
Now, customers using QAI can specify the name of the QAI check, so that it is clearer to their own internal review team, subcontractors, or end customer, exactly what was reviewed.
PIONEER - making it easy to organize and QC your data your way.

One powerful feature of our PDF and HTML reporting are our "smart diagrams" that adapt as you add observations to your inspections.
You get exactly the data you need on your pipe diagram, separated to it's easy for anyone not an expert in NASSCO to interpret.
- We always "pin" grade 3 to 5 defects to the left
- Next comes "Connections," which we have renamed from "Taps"
- Then comes Miscellaneous, which covers your Water Levels and Survey Abandoned (MSA)
- Then come lines for any other conditions observed in the asset; in the example below, those are Deposits and Surface Damage

Some times you need to create a brand new inspection row in PIONEER, even when you aren't using our Desktop (truck) app.
You can always do this in bulk with CSV imports.
But do you need to make just 1 inspection? Maybe to support an MACP workflow where you just found a new manhole?
New: "Add Inspection" from the dashboard on Web or Mobile
On the Web

On Your Phone
- see the blue "+" symbol in the lower left of your dashboard

We’ve made exciting updates to the Analytics Dashboard in Pioneer! If you haven’t explored it yet, check it out here: Pioneer Analytics Dashboard.
The dashboard now provides powerful insights into your project data and your organization’s operations.
✅ Monitor Performance: Optimize operator efficiency and track daily activity.
✅ Uncover Trends: Filter, compare, and analyze data to drive smarter decisions.
✅ Track Progress: View key data to keep projects on time and under budget.

And we’d love to hear how it’s working for you—or how we can make it even better! After exploring the dashboard, feel free to share your feedback directly via ⚡Pioneer Feedback, or if you’d prefer a more in-depth discussion, you can schedule a quick meeting using this link:
Dive in and get insights into your project data and organization's operations! 🚀
We have released v2.0 our of GIS maps experience
It comes with:
- Search by Address or AssetID
- Satellite and Streets base layers
- Filter by any of our dozens of powerful inspection filters
- Colorize your map by PIONEER status or Pipe Rating
Plus, as you zoom to assets you see
- Flow direction
- Observations for coded inspections
- Ratings and photos of your observations
- all the historical inspections for any given asset
Full walk through:
Does your client want a 1 or 2 page report on inspections? Are you a lining company that needs to give only the most critical info to your team?
Now available:
quick reports
- a shorter version of our PDF and HTML reports. What it contains
1) Header information - we display only what your team filled in / required fields
2) Ratings
3) A pipe diagram with all the Observations and their supporting data

Access it 3 ways
- From the Dashboard center bar any time you select inspections
- As part of an Export package
- From any inspection video review page
The NASSCO "Quick Rating" is one of the most helpful metrics to understand the severity of the conditions in a pipe.
Need to quickly sort the inspections in a project by Quick Rating. Now you can do that on our Dashboard view.
1) Expose any of the "Quick Rating" columns with the gear icon
2) Click the column to sort ascending or descending.
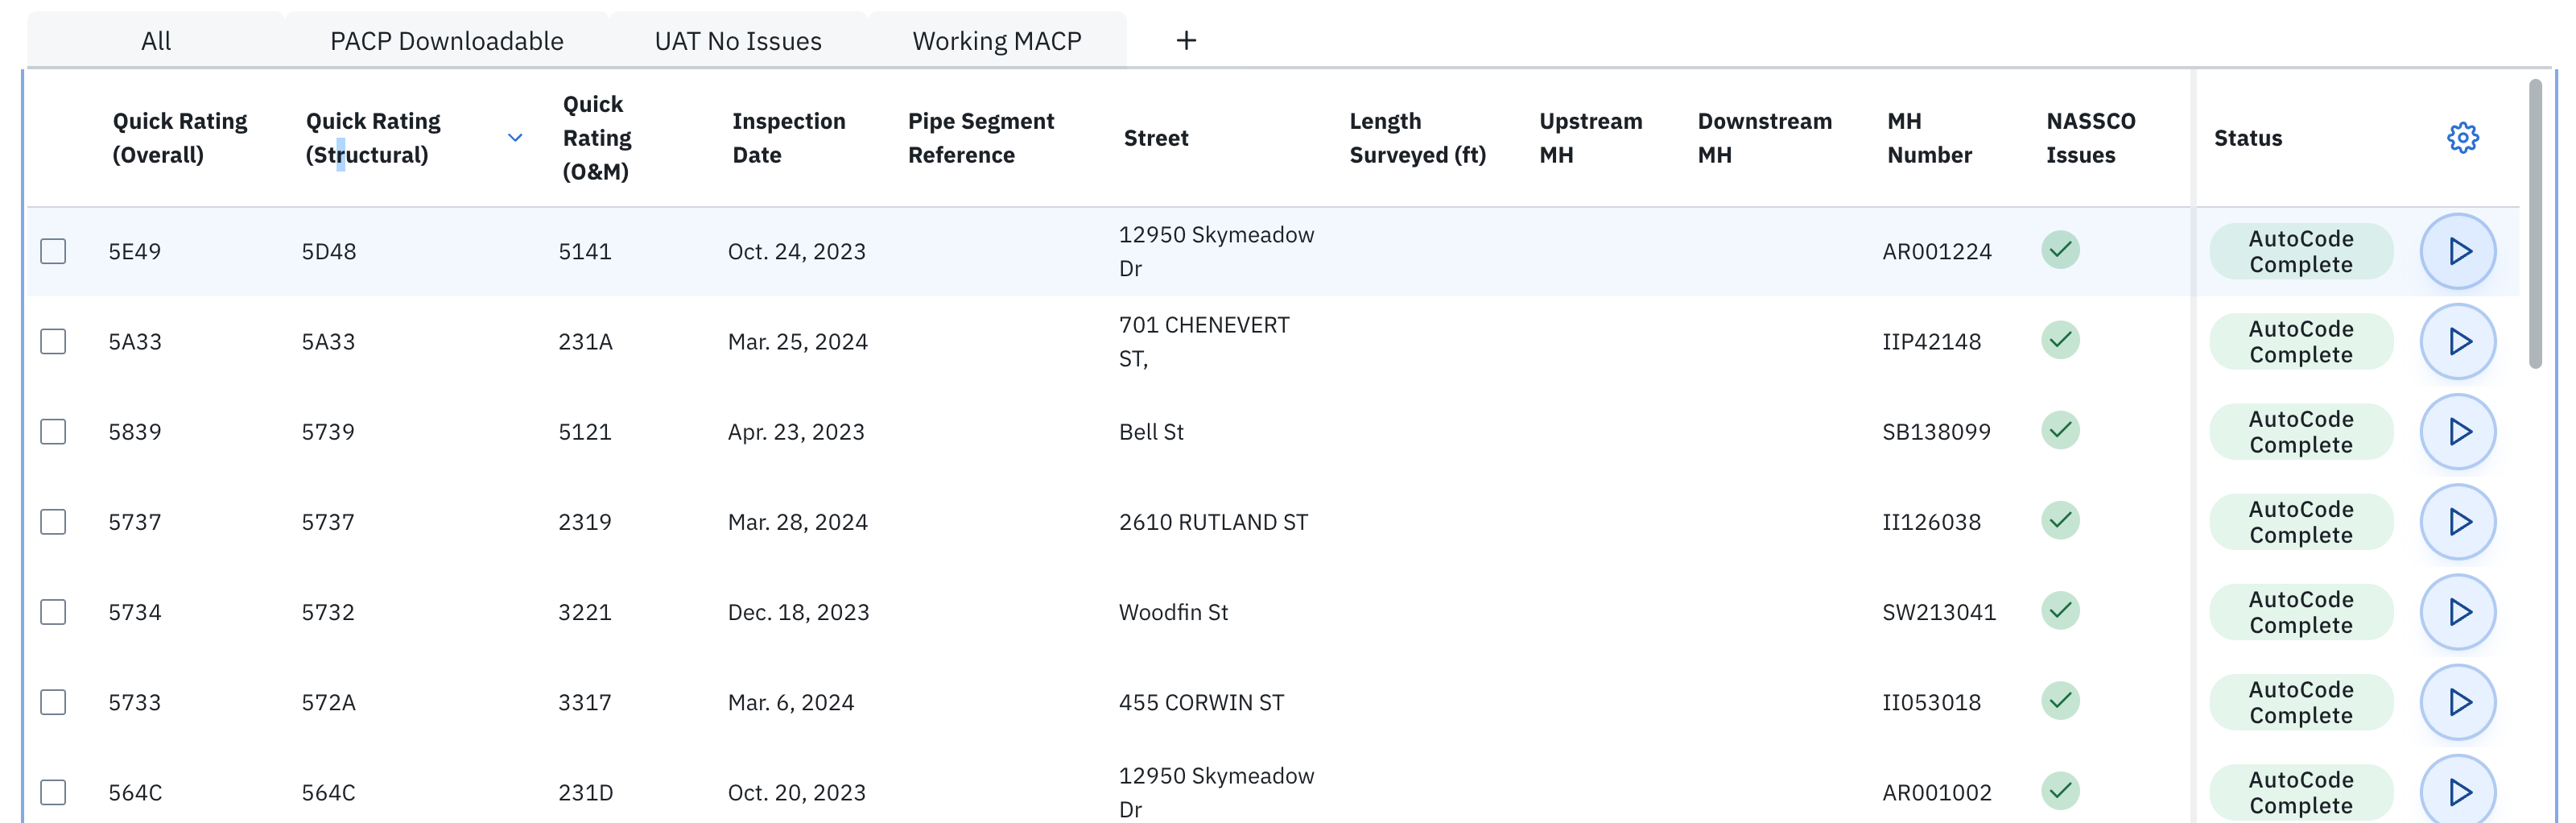
Here we are sorted by Structural Quick Rating; 5D48 is the worst.
Understanding Quick Rating
- The first digit is highest graded condition.
- The second digit is a count of those conditions (A = 10-14, B = 15-19, etc.).
- Third digit is second-highest graded condition.
- Fourth digit is the count of those conditions.
We heard you. You wanted your PDF reports to include:
- NASSCO header fields that all fit on one page. No extra pages.
- To not see blank header data fields; only show fields with content.
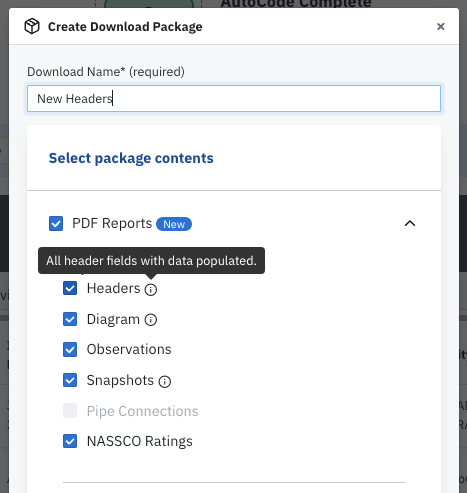
If you select "Headers" we will include a single page in your PDF report that does just this.
It includes
1) About a dozen key fields
2) The rest of the fields auto-size to the data you have filled in. If any inspection in your printed set has data for the field, we will include it.
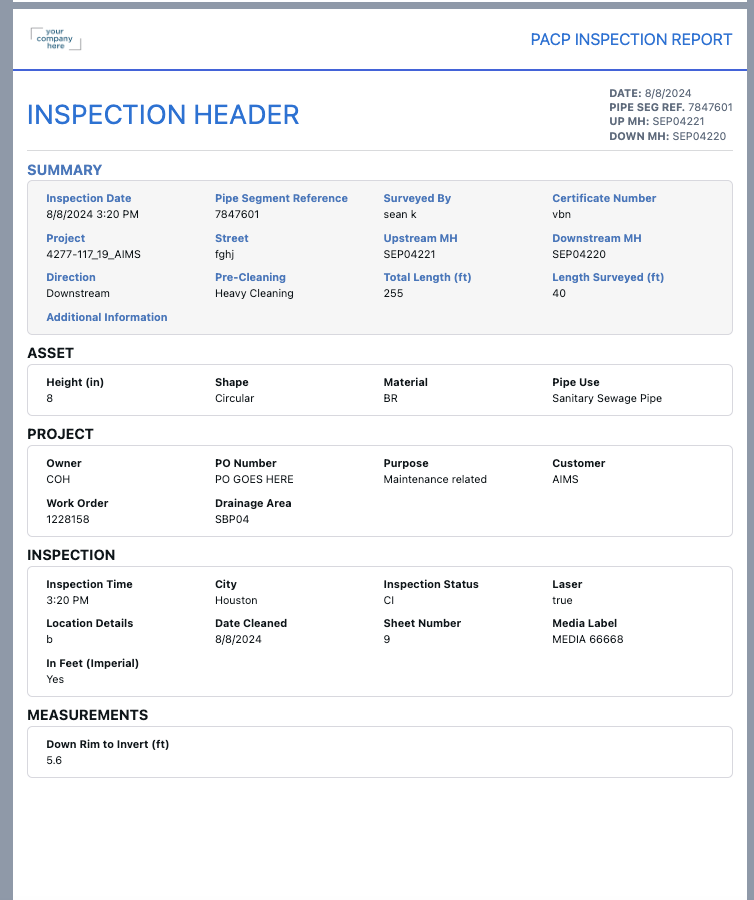
You can check out this sample report as an example.
Load More
→